jcampos
November 9, 2021, 10:58pm
1
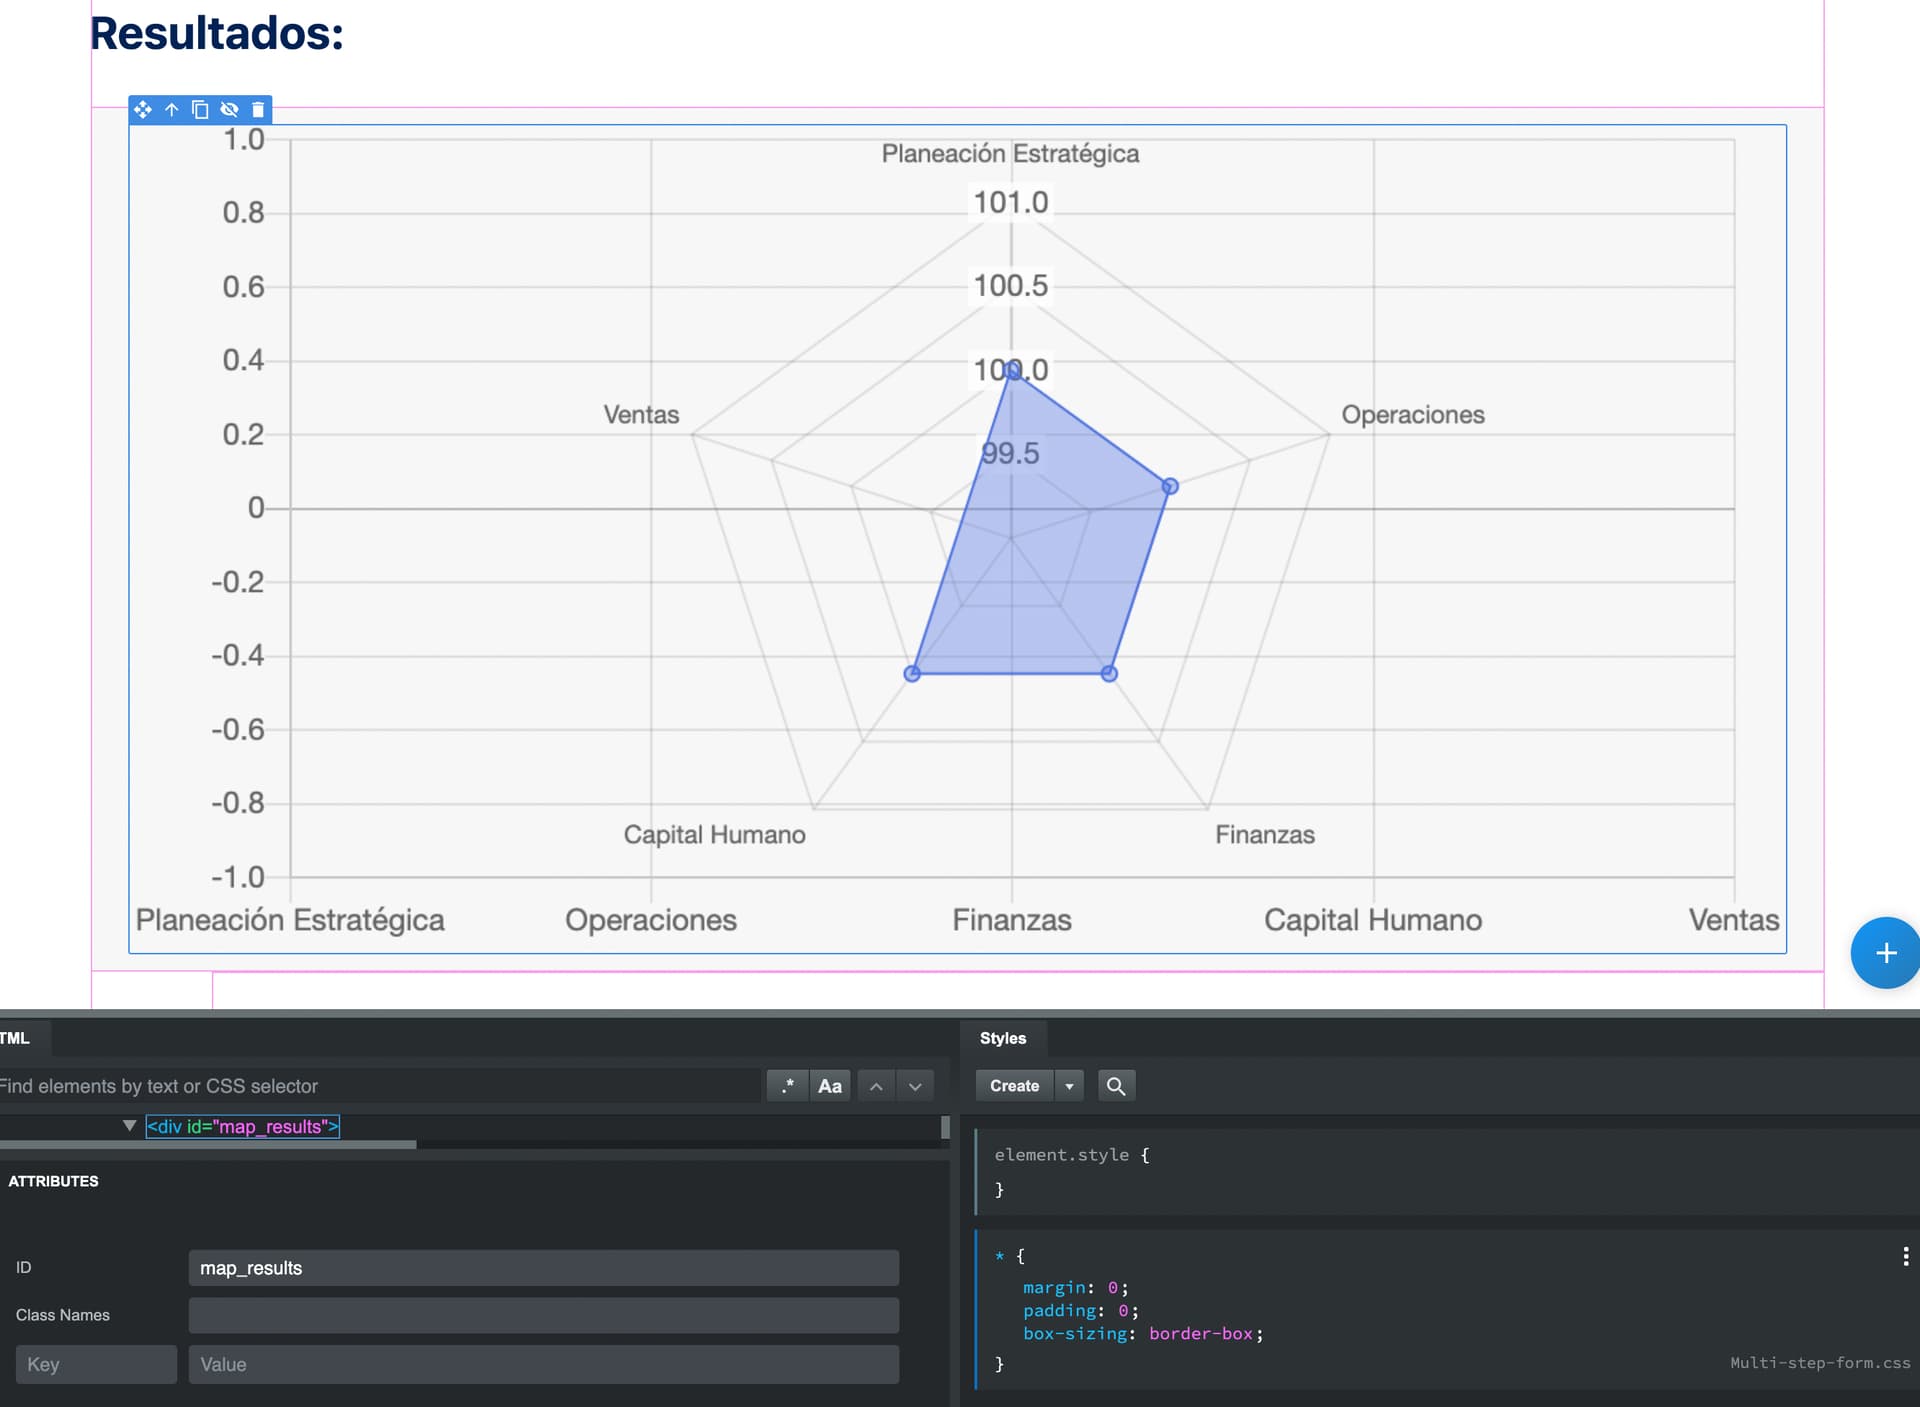
Hi, I’m trying to update a Map-Chart in my web site.
let chart_map = document.querySelector('#map_results canvas').chart;
Next instructions are:
  chart_map.data.datasets[0].data[2] = 10000;
        chart_map.update();
I also tried with:
  chart_map.title.display = true;
  chart_map.title.text = "Hello world";
  chart_map.update();
But I get the same error:
TypeError: undefined is not an object (evaluating ‘chart_map.title’)
It seems that I’m not getting the correct reference in the first instruction.
How is the correct way to access to my chart to update its values?
I reviewed this case:
But I think that it’s what I’m doing.
Kind regards
You can try this
let chart_map = document.querySelector('#map_results canvas').chart;
chart_map.data.datasets[0].data[2] = 10000;
chart_map.options.title.display = true;
chart_map.options.title.text = "Hello world";
chart_map.update();
jcampos
November 10, 2021, 12:18am
3
Hi @kuligaposten ,
I tried your code but I’m getting the same error:
TypeError: undefined is not an object (evaluating ‘chart_map.data’)
The error is in the line:
chart_map.data.datasets[0].data[2] = 10000;
When I removed this line, the error is in the line:
chart_map.options.title.display = true;
It seems that my problem is related to get the correct reference.
I set the label to the graph it self, I’m not sure if this is correct (Attached image).
The querySelector (’#your-id canvas’).chart return an undefined value that’s why you get an TypeError when you try to assign a value to undefined. I think that’s a bug from the last time the chart component was updated. If you create your canvas via custom code or javascript and call the Chart constructor in you javascript file everything works as expected.
Chartjs example
BTW if you click on the link in BSS docs to chartJS Api it will take you to chartJS 3.6. BSS use chartJS 2.8 so make sure that you read the right docs on chartJS otherwise nothing will work for you
@jcampos
I had a quick look this morning what was wrong
this document.querySelector('#map_results canvas').chart; require jQuery
$(function(){

    let chart_map = document.querySelector('#map_results canvas').chart;
	chart_map.data.datasets[0].data[2] = 10000;
    chart_map.options.title.display = true;
    chart_map.options.title.text = "Hello world";
	chart_map.update();

});
this document.querySelector('#map_results [data-bss-chart]').chart; vanilla Javascript
document.addEventListener('DOMContentLoaded', function() {

    let chart_map = document.querySelector('#map_results [data-bss-chart]').chart;
    chart_map.data.datasets[0].data[2] = 10000;
    chart_map.options.title.display = true;
    chart_map.options.title.text = "Hello world";
    chart_map.update();

}, false);
jcampos
November 10, 2021, 3:26pm
6
Hi @kuligaposten ,
Your last comment made all the difference. My chart is working now.
Thank you so much for your help.
1 Like